Our backend was crashing completely when load increased. Not just a single time, basically everytime when it was not idling. As it turned out, our messaging system, ActiveMQ (provisioned via Amazon MQ) was no able to handle our load requirements. After several iterations of analysis and adjustments without significant results, we decided to migrate to AWS SQS. This blog article describes which metrics we used and implemented to track the healthiness of message processing on AWS SQS.
By: Niklas Enns
Use Case
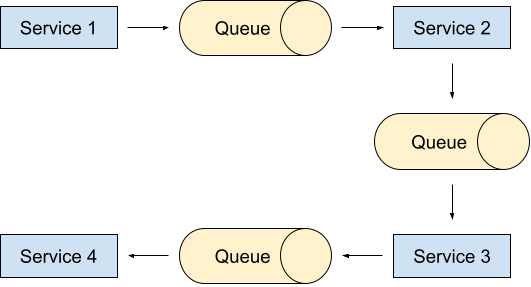
Simplified, our architecture corresponds to an assembly line. Service 1 accepts external requests, performs a little bit of processing and passes a modified version of the initial request to next service via an AWS SQS queue. This pattern repeats itself until Service 4 is able to provide the response of the initial request.
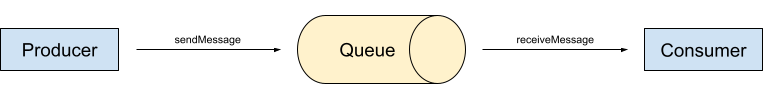
When we migrated the queues from ActiveMQ to AWS SQS, we wanted to get some insights whether the communication via SQS works properly. For our use case, this breaks down to three simple questions that should be answered for each queue:
- Is the producer able to send messages?
- Is the consumer able to receive messages?
- Are messages piling up on the queue?
Let’s start with question 3. Amazon CloudWatch provides a rich set of SQS metrics out of the box. One of them is called ApproximateNumberOfMessagesVisible which translates to the current length of the queue. When messages pile up, this metric goes up, question answered.
But what’s about the other questions? Maybe CloudWatch can answer them aswell? Indeed, there are two more promising metrics called NumberOfMessagesSent and NumberOfMessagesReceived. They count inbound and outbound messages from the perspective of SQS. Consequently, they can only show that an operation worked successfully or the absence of operations when the system is idling.
However, there is one additional crucial case: When operations fail. This is only visible from producers or consumers point of view. Therefore, we implemented our own metrics which we collect via Prometheus and visualize with Grafana.
Custom Metrics Design
Prometheus supports 4 basic metric types: Counter, Gauge, Histogram and Summary. The gut feeling told us that Counters for the send-and receive operations are a promising direction. Moreover, we have to count successful and failed operations separately. To achieve this, there are multiple approaches none of which seem obviously wrong or right.
One approach is to have one counter per operation and a label which tells whether it executed successful or not. The label would have the name „result“ and the possible values are „success“ and „failure“. Instead of splitting the result into two label-values, it would also be possible to have one counter for successful attempts and another one for failed attempts – also sounds reasonable. At the end of the day, we decided to have one counter for all attempts and another one for the failed ones only, inspired by a Prometheus Best Pracices recommendation.
| name | type | labels |
| aws_sqs_submissions_total | counter | queue url |
| aws_sqs_receives_failures_total | counter | queue url |
| name | type | label |
| aws_sqs_receives_total | counter | queue url |
| aws_sqs_receives_failures_total | counter | queue url |
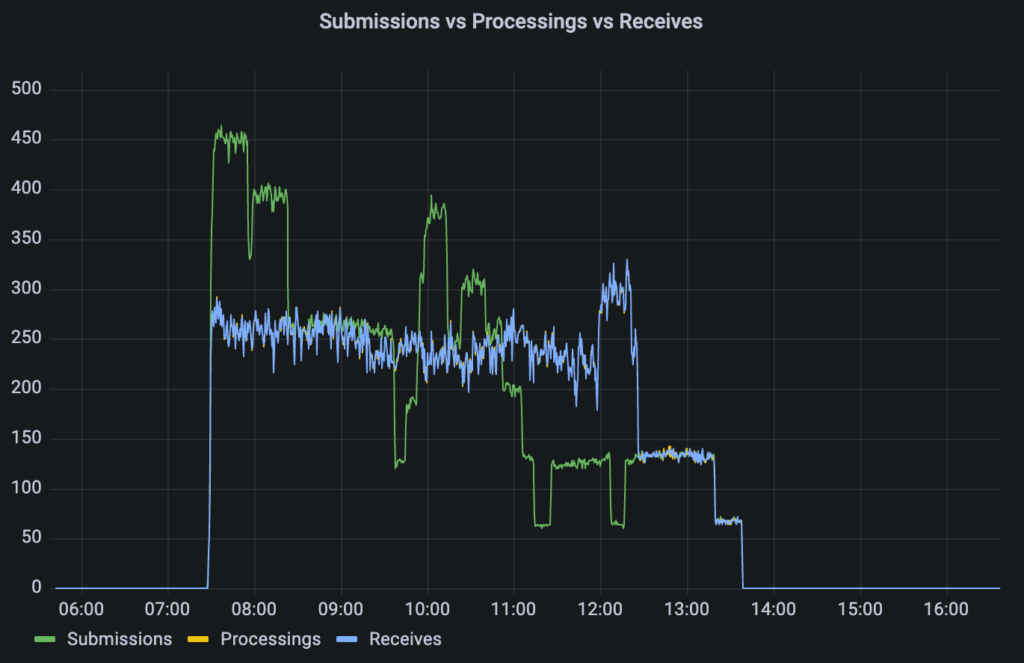
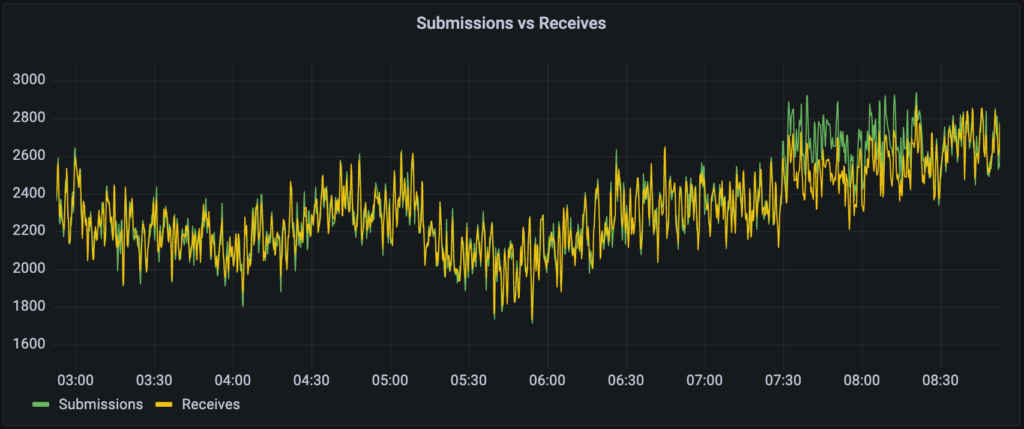
Based on these counters, it is relatively easy to create Grafana dashboards which calculate and visualize the according rates.
Extending for Processing Metrics
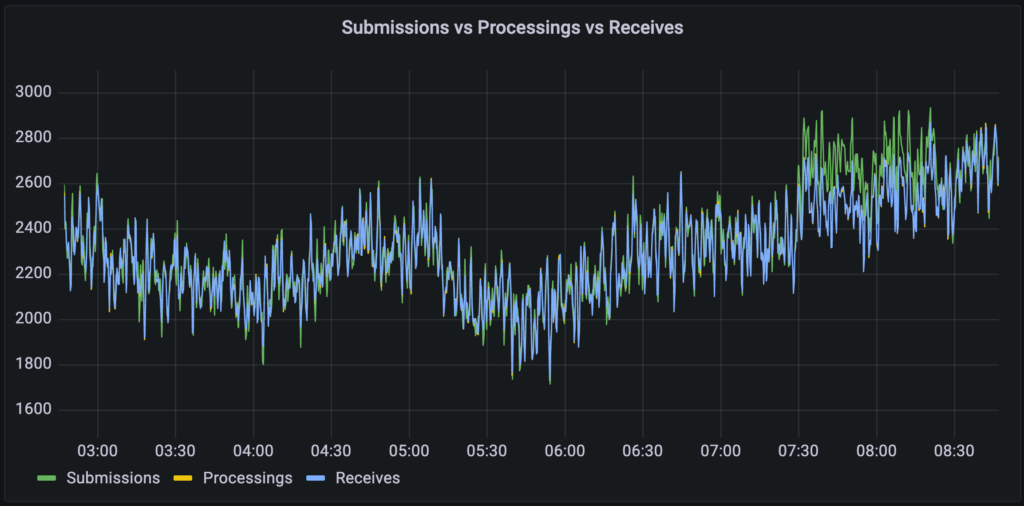
As we were discussing and designing new metrics around SQS communication, we spotted a low-hanging fruit: Gathering metrics from the message processing. Although performance and error monitoring wasn’t a topic at the time of the SQS migration, we felt that it could be useful in the future. So, we added a few counters for message processing and another metric which represents the processing durations.
| name | type | label |
| aws_sqs_processing_total | counter | queue url |
| aws_sqs_processing_failures_total | counter | queue url |
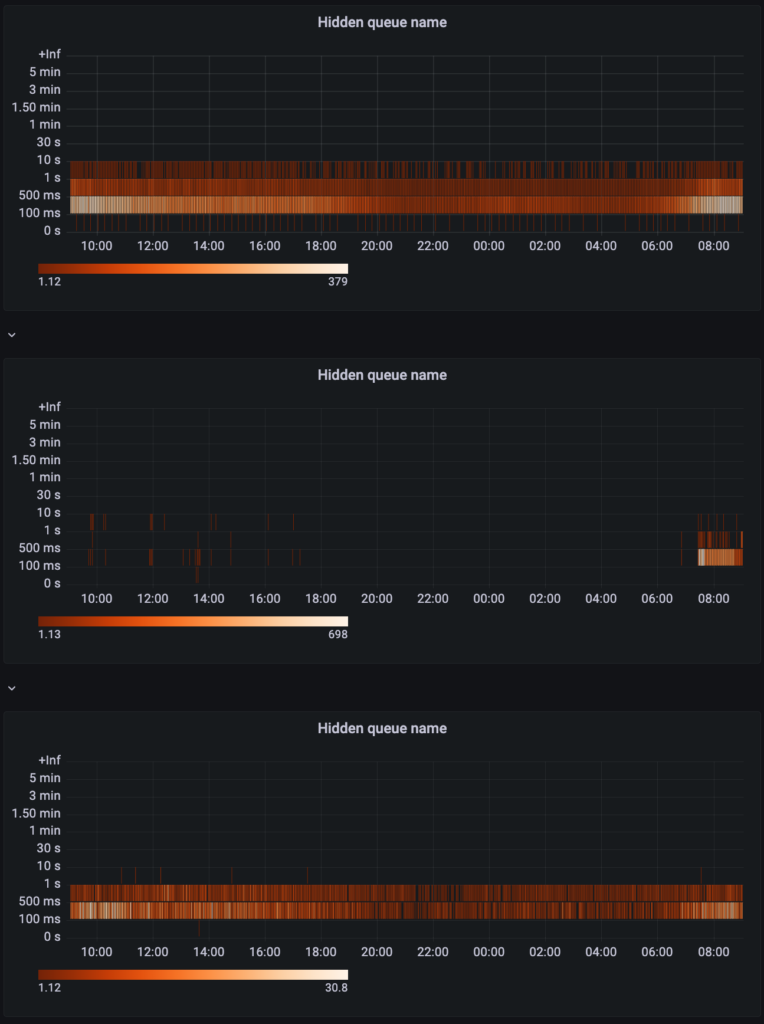
| aws_sqs_message_processing_duration_in_seconds | histogram | queue url |
The processing duration histogram can be turned into Grafana heatmaps which are basically „Histograms over time“.
Failures
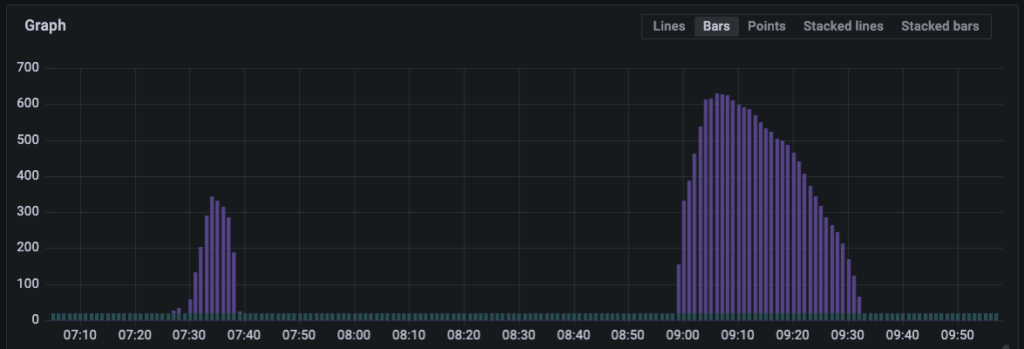
The previous screenshots show only the successful cases of SQS communication and message processing. Regarding the error cases of communication, I want to share the graphs of the raw counter values of 30 days PROD activity.
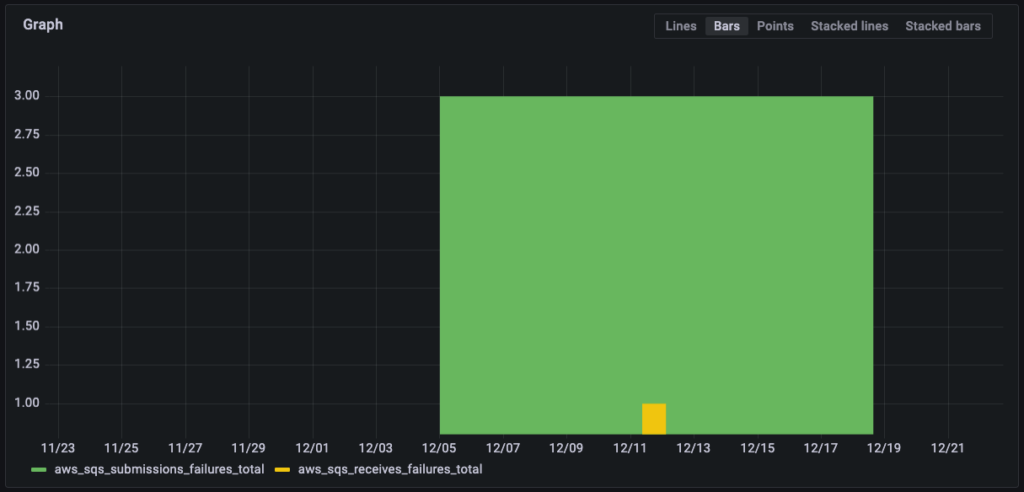
This is a sum of 4 failed attempts accessing AWS SQS (from an EKS cluster) – great! The graph of processing errors is classified as confidential data ;-).
Recap
So, does our solution answer our initial questions?
tl;dr Yes. Every outcome of a send or publish operation will be reflected by a metric. Apart from that, our implementation is also able to show the general messaging activity, because we can easily calculate and visualize the sending and receiving message rates. Last but not least, we were also able to detect a leakage (messages that are sent but never received) when we saw that we had a constant difference between the sending and receiving rate on one queue. It turned out that this was an error on our side. We enabled SQS’s content-based deduplication in order to filter out unwanted duplicates but in this case, SQS removed too much – we need these messages. A small adjustment of the deduplication ID fixed that issue.
Is the implementation satisfying?
I think that the chosen counter design (total and failed) has the disadvantage that it is harder to understand than a symmetric design like „successful“ and „failed“ attempts. While the latter seems to be self-explanatory, the total/failed split tends to require a bit more effort of explanation. Being in a rush, this design is more likely to be misunderstood. But all in all, it serves its purpose and doesn’t limit future use cases.
★★★★☆
Outlook
Our solution is able to provide metrics for AWS SQS communication and message processing. Further insights can be gained by incorporating the other two pillars of observability: logging and tracing. Although alerting was not part of this blog article, the metrics can be used for alerting easily.